Wed, Mar 22, 2006

Advertisement
More News
 Aero-News: Quote of the Day (05.25.24)
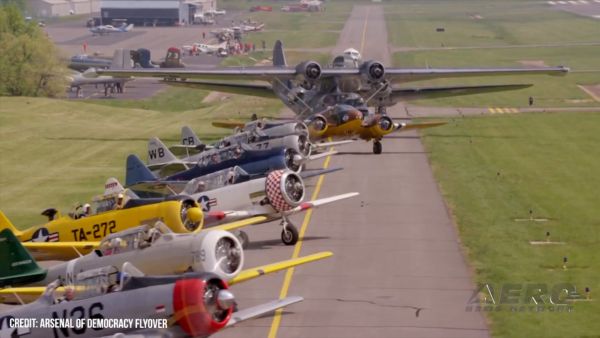
“Warbirds in Review features veterans, aviation legends, and aircraft that simply cannot be seen together in one place anywhere else in the world. Many of these veterans main>[...]
Airborne 05.22.24: NS-25 Chute Failure, #HonorTheWASP, SkyCourier 'Combi'
Also: VAI v Anti-Heli Actions, Electric Aircraft Symposium, 2024 FAA Drone/AAM Symposium, Gravitymaster Blue Origin's seventh passenger flight ended with a smidgeon of drama when o>[...]
Aero-News: Quote of the Day (05.26.24)
“The importance of this YF-16 paint scheme is celebrating 50 years of the F-16 Viper. Everyone at Edwards has a big sense of pride for not only supporting the Viper Demo Team>[...]
ANN's Daily Aero-Linx (05.26.24)
Aero Linx: National Aeronca Association We are dedicated to supporting the design and preserving the history of Aeronca aircraft. Founded by Jim Thompson and fostered by his leader>[...]
Klyde Morris (05.24.24)
Klyde Sounds Like He's Defining An 'Influencer' FMI: www.klydemorris.com>[...]
blog comments powered by Disqus