Sales Data For Business Jet, Business Turboprop Aircraft,
Helicopters
 February sales trends for pre-owned business jet, business
turboprop, and helicopter markets have been released by JetNet, a
corporate aviation information service. The company says the data
shows that the reality is the current business down cycle will last
longer than the industry would like, but the good news is that the
business aircraft and helicopter markets are mostly on the right
track. The company finds that slow domestic sales are continue to
have a significant impact on the inventory of existing bizjets.
February sales trends for pre-owned business jet, business
turboprop, and helicopter markets have been released by JetNet, a
corporate aviation information service. The company says the data
shows that the reality is the current business down cycle will last
longer than the industry would like, but the good news is that the
business aircraft and helicopter markets are mostly on the right
track. The company finds that slow domestic sales are continue to
have a significant impact on the inventory of existing bizjets.
During the decade of the 1990s the ratio ranged from a high of
83/17 to a low of 66/34 and then increased again to 79/21 for much
of the decade of the 00s. However, starting in 2008 this ratio
declined rapidly over a two-year period, ending with a 67/33 ratio
in 2010 (Chart A). In our view, this change in direction has had an
impact on the stubbornly high For Sale inventory levels we
witnessed throughout 2010.
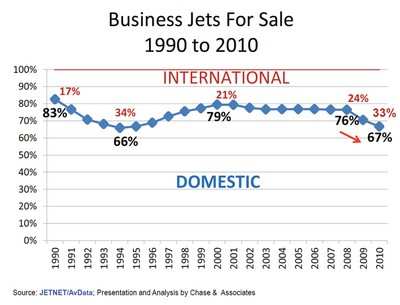
Chart A
Examining he key worldwide trends across all aircraft market
segments, comparing February 2011 to February 2010 (Table A),
business jet inventory percentage For Sale showed the largest
change (down 1.4 points), to 14.4% from 15.8%. Both turbine and
piston helicopter sectors were basically unchanged in percentage
For Sale for February 2011 compared to 7% for the same period in
2010
Business Jet Sale Transactions increased 17.2% YTD in February
2011 compared to the same period in 2010. Business turboprops also
showed a positive change of 10.4%. Both helicopter categories saw
large double-digit declines in sale transactions (down 31% for
turbine and 28.5% for piston) YTD in February 2011 vs. 2010, in a
further softening of asking prices across all sectors.
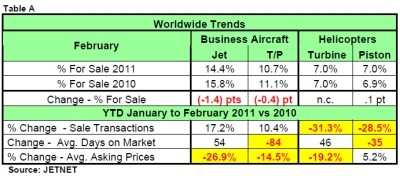
Table A
All pre-owned aircraft categories showed large decreases in
average asking price percentages except piston helicopters, with an
increase of 5.2%. The decreases in average asking price ranged from
-26.9% for business jets to -14.5% for business turboprops and
-19.2% for turbine helicopters.
The build-up in Business Jet For Sale inventory decreased to
2,586, or 14.4%, in February 2011 from 2,731, or 15.8%, in February
2010. The Business turboprop market continues to hover just under
the 1,400 for sale inventory level, down to 10.7% in February 2011
from 11.1% in February 2010. So the company says that makes for
stubbornly high levels of for-sale inventories as we remain in a
buyer’s market, with business jets showing for-sale
percentages greater than 10%. A seller’s market is when 10%
or less of the pre-owned business jets are for sale.
Looking at the business jet results for February 2011 compared
to February 2010 (Table B), inventory continues to decline with
full sale transactions increasing by 26.3% for February 2011. This
increase is a positive sign but unfortunately at much lower prices
(down 28.6%). In comparing the YTD figures for February 2011,
asking prices remain soft (down 26.9%) and the length of time on
the market, at 398 days, is about 2 months longer (54 more days)
than in the comparable YTD period for February 2010.
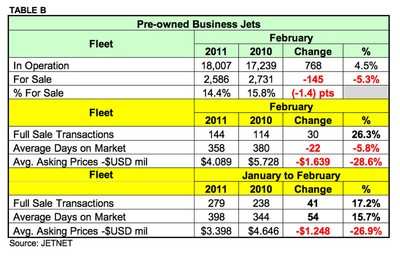
Table B
The business turboprop results for February 2011 (Table C),
compared to February 2010, indicates the average asking price has
declined by 3.7%, to an average of $1.357 million. Average Days on
Market has been shortened by 99 days to 249 days. However, the good
news is that the business turboprop market saw a large percentage
change in February, increasing by 38%. The YTD Full Sale
Transactions figure for February 2011 saw an increase of 10.4% (and
in fewer days on the market), but at a 14.5% decline in the average
asking price.
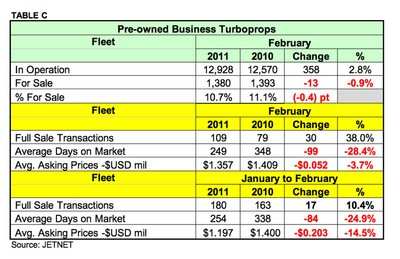
Table C
There was no change in the number of pre-owned turbine
helicopters for sale in February 2011, holding steady at 7.0% (a
buyer’s market) when compared to February 2010 (Table D). A
buyer’s market in the helicopter world is when the percentage
of helicopters for sale exceeds 5% of the fleet. The number of
pre-owned Full Sale Transactions for turbine helicopters declined
by 31.3% YTD in February 2011 compared to 2010. Average Days on
Market for turbine helicopters was 390 days, 46 days longer on the
market than during the same period in 2010. However, the average
asking price fell by 19.2% YTD in February 2011 compared to
February 2010.
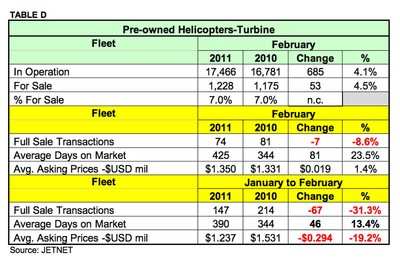
Table D
The number of pre-owned piston helicopters for sale in February
2011 (excluding Russian-built aircraft) was 635 helicopters, or
nearly half the number of turbine helicopters (Table E). The
percentage for sale of 7.0% in 2011 (a buyer’s market) was
nearly the same as the 6.9% seen in February 2010. The number of
pre-owned Full Sale Transactions for piston helicopters decreased
by 21% in February 2011 compared to February 2010. Average Days on
Market for piston helicopters was 224 days, 63 days less in 2011
than in 2010. However, the average asking price for piston
helicopters jumped by 14.8% in February 2011 compared to February
2010.
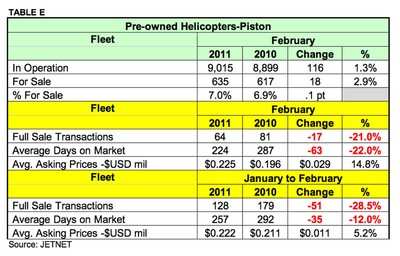
Table E
The YTD average asking price increase of 5.2% has resulted in
28.5% fewer Full Sale Transactions. However, the Average Days on
Market has declined by 35 days.
 ANN's Daily Aero-Term (05.16.24): Instrument Runway