Mission Controllers Say Radar And Radiometer 'Performed As Expected'
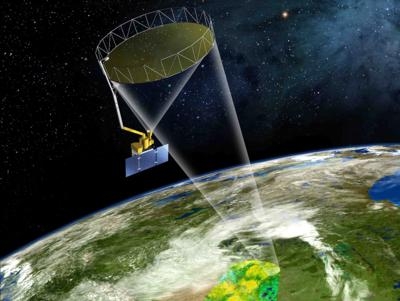
Fresh off the recent successful deployment of its 20-foot reflector antenna and associated boom arm, NASA's new Soil Moisture Active Passive (SMAP) observatory has successfully completed a two-day test of its science instruments.
The observatory's radar and radiometer instruments were successfully operated for the first time with SMAP's antenna in a non-spinning mode on Feb. 27 and 28. The test was a key step in preparation for the planned spin-up of SMAP's antenna to approximately 15 revolutions per minute in late March. The spin-up will be performed in a two-step process after additional tests and maneuvers adjust the observatory to its final science orbit over the next couple of weeks.
Based on the data received, mission controllers concluded the radar and radiometer performed as expected. The controllers are based at NASA's Jet Propulsion Laboratory, Pasadena, California; and NASA's Goddard Space Flight Center, Greenbelt, Maryland.
SMAP launched Jan. 31 on a minimum three-year mission to map global soil moisture and detect whether soils are frozen or thawed. The mission will help scientists understand the links in Earth's water, energy and carbon cycles; help reduce uncertainties in predicting weather and climate; and enhance our ability to monitor and predict natural hazards such as floods and droughts.
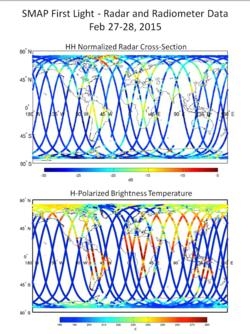
The first test image illustrates the significance of SMAP's spinning instrument design in producing more comprehensive maps. For this initial test with SMAP's antenna not yet spinning, the observatory's measurement swath width -- the strips observed on Earth in the image -- was limited to 25 miles. When fully spun up and operating, SMAP's antenna will measure a 620-mile-wide swath of the ground as it flies above Earth at an altitude of 426 miles. This will allow SMAP to map the entire globe with high-resolution radar data every two to three days, filling in all of the land surface detail that is not available in this first image.
The radar data illustrated in the upper panel of the image show a clear contrast between land and ocean surfaces. The Amazon and Congo forests in South America and Africa, respectively, produced strong radar echoes due to their large biomass and water content. Areas with no vegetation and low soil moisture, such as the Sahara Desert, yielded weaker radar echoes. As expected, the dry snow zone in central Greenland, the largest zone of the Greenland ice sheet where snow does not melt year-round, produced weaker radar echoes.
Surrounding areas in Greenland's percolation zone, where some meltwater penetrates down into glaciers and refreezes, had strong radar echoes due to ice lenses and glands within the ice sheet. Ice lenses form when moisture that is diffused within soil or rock accumulates in a localized zone. Ice glands are columns of ice in the granular snow at the top of glaciers.
The test shows that SMAP's radiometer is performing well. The radiometer's brightness temperature data are illustrated in the lower panel. Brightness temperature is a measurement of how much natural microwave radiant energy is traveling up from Earth's surface to the satellite. The contrast between land and ocean surface is clear, as it is in the radar image. The Sahara Desert has high brightness temperatures because it is so hot and has low soil moisture content. The Indian subcontinent is currently in its dry season and therefore also has high brightness temperatures. Some regions, such as the northeast corner of Australia, show low brightness temperatures, likely due to the high moisture content of the soil after heavy rainfall from Cyclone Marcia in late February.
(Images provided by NASA)
 ANN's Daily Aero-Term (04.24.24): Runway Lead-in Light System