Thu, Feb 16, 2006
Advertisement
More News
 Airbus Racer Helicopter Demonstrator First Flight Part of Clean Sky 2 Initiative
Airbus Racer Demonstrator Makes Inaugural Flight Airbus Helicopters' ambitious Racer demonstrator has achieved its inaugural flight as part of the Clean Sky 2 initiative, a corners>[...]
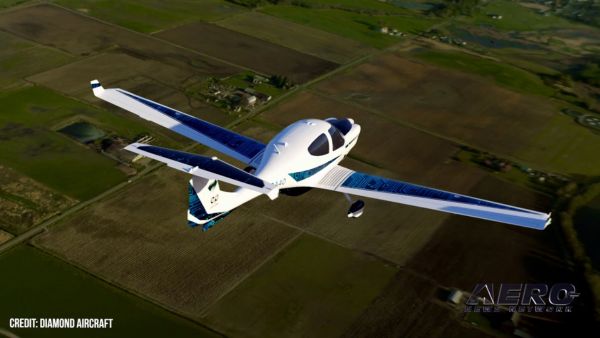
Diamond's Electric DA40 Finds Fans at Dübendorf
A little Bit Quieter, Said Testers, But in the End it's Still a DA40 Diamond Aircraft recently completed a little pilot project with Lufthansa Aviation Training, putting a pair of >[...]
ANN's Daily Aero-Term (04.23.24): Line Up And Wait (LUAW)
Line Up And Wait (LUAW) Used by ATC to inform a pilot to taxi onto the departure runway to line up and wait. It is not authorization for takeoff. It is used when takeoff clearance >[...]
NTSB Final Report: Extra Flugzeugbau GMBH EA300/L
Contributing To The Accident Was The Pilot’s Use Of Methamphetamine... Analysis: The pilot departed on a local flight to perform low-altitude maneuvers in a nearby desert val>[...]
Classic Aero-TV: 'Never Give Up' - Advice From Two of FedEx's Female Captains
From 2015 (YouTube Version): Overcoming Obstacles To Achieve Their Dreams… At EAA AirVenture 2015, FedEx arrived with one of their Airbus freight-hauling aircraft and placed>[...]
blog comments powered by Disqus